I’ve known for many years that standard AC power in the US has a nominal frequency of 60Hz. This may or may not be typical coffee-table conversation material, but it’s no secret, being stated on many electronic devices produced for US use. What I didn’t know until recently was just how central maintenance of the exact design frequency is to the distribution of power: apparently, when the load increases without a proportional increase in supply, the frequency drops. When load is removed from the network (or additional power is added), the frequency rises. In addition, synchronizing all of the power sources and loads on the network requires precise coordination of not only frequency, but phase.
This begs the question — how much does the power-network frequency vary? Could you use it as reference for a wall clock? If it were a musical note, would it be consistently on-key? Could you use it as a lab-quality timebase? This calls for an investigation!
The first obstacle to this, of course, is voltage. Standard household AC power in the U.S. is 120V RMS, or ~169.706V peak, or ~339.411V peak-to-peak. (So, as high as “120 volts” sounds, that’s actually quite an understatement!) Piping this directly in to sensitive modern electronic equipment is a guaranteed way to let all of the magic smoke out — and probably start a fire, for good measure. A way is needed to reduce this down to a reasonable level.
It would be straightforward to use a transformer, but that’s not really needed here. With some precautions, a simple voltage divider will do. A few considerations are important. First, the output voltage should be relatively low — say, less than 5V peak-to-peak. Second, since small 1/4-watt resistors will be used, current must be very low — specifically, under 1/480 amp (120V RMS, times this current, must be no more than 1/4 watt.)
The second requirement means that the total resistance must be no less than (120/(1/480)) = 57.6 kilohms. To satisfy the first (voltage) requirement, the ratio between the two resistors should be no more than 1:40 or so, preferably a bit more. I ended up going with a 1-megohm and a 1-kilohm resistor; this should result in RMS current of about 120uA and an output voltage of about 120mV RMS (~339mV peak-to-peak.)
Finally, the connection order matters — at least for safety. According to US code, AC wiring is done with black and white shrouded conductors (with green present as ground, on three-conductor cords.) White is neutral (which ideally should have a voltage near Earth ground and therefore be reasonably safe to expose), and black is “hot” — the active line, which should never be exposed outside a device. Consult your local electrical codes (or better yet, get a qualified professional to help you) if you’re not completely sure of what you’re doing. High-voltage AC power can kill.
The idea is to expose only the neutral line and the (slightly higher than ground, and still probably safe) voltage-divided line. Therefore, the large 1-megohm resistor is connected to AC “hot,” and the 1-kilohm is connected to the neutral. The two output wires are connected to the neutral line and the junction of the two resistors (see schematic below.)
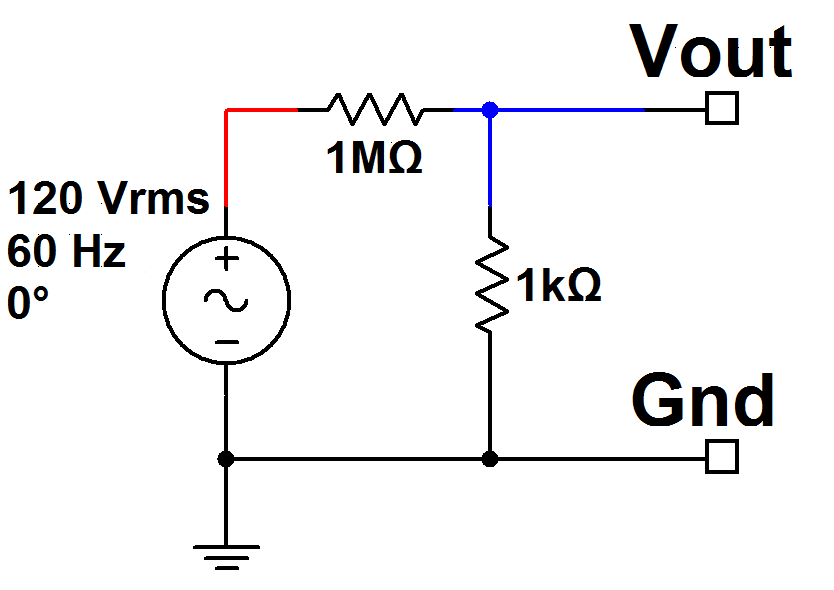
A bare-bones circuit for reducing the AC voltage. "Ground" is really the Neutral line -- which should be the white wire in the US, if your electrical installation is compliant with current US code. Don't bet your life on this, though!
If I were going to do this right (to make it into a commercial product, or to use it on a regular basis etc), it would need a few more important features. I’d consider the following a minimal list — and even then, I’m not an expert in power electronics. It might be best to go with a transformer — but I was trying to avoid using any reactive components here. For safety, I’d add:
- A fuse in the “hot” line, just after it comes from the plug;
- 1K resistors (or perhaps higher) in series with the Vout and Ground lines;
- A pair of back-to-back Zener diodes connected between Vout and Ground, to limit output voltage to a safe level.
Once the “quick-and-dirty” voltage divider circuit above was built (and carefully tested several ways), I was able to connect it to a frequency counter and log the frequency of the AC power over time. Here is a time-domain graph and a histogram of what I found, along with a graph showing a few strange anomalies in the raw data…
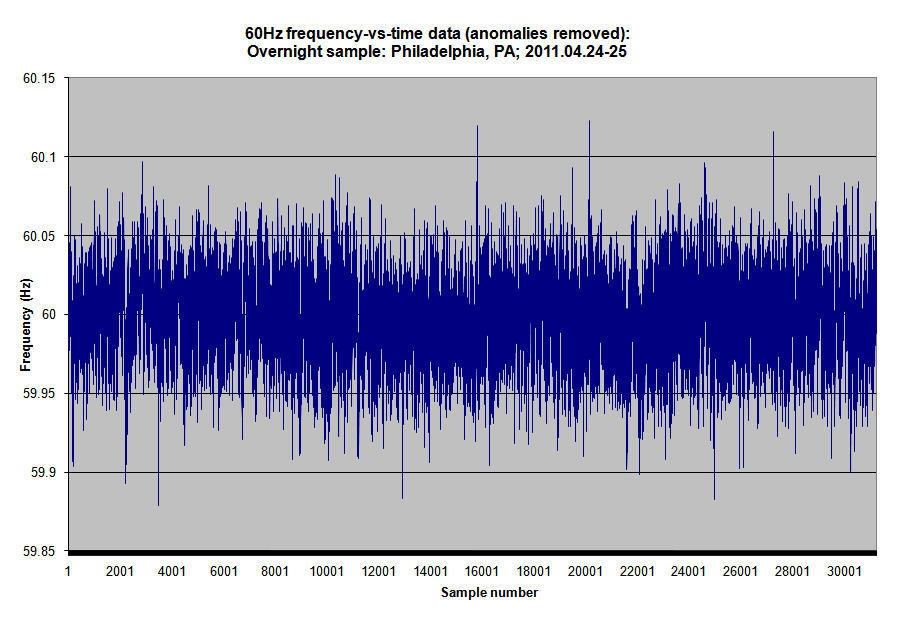
Frequency-vs-time graph (anomalies removed.) Click for larger.
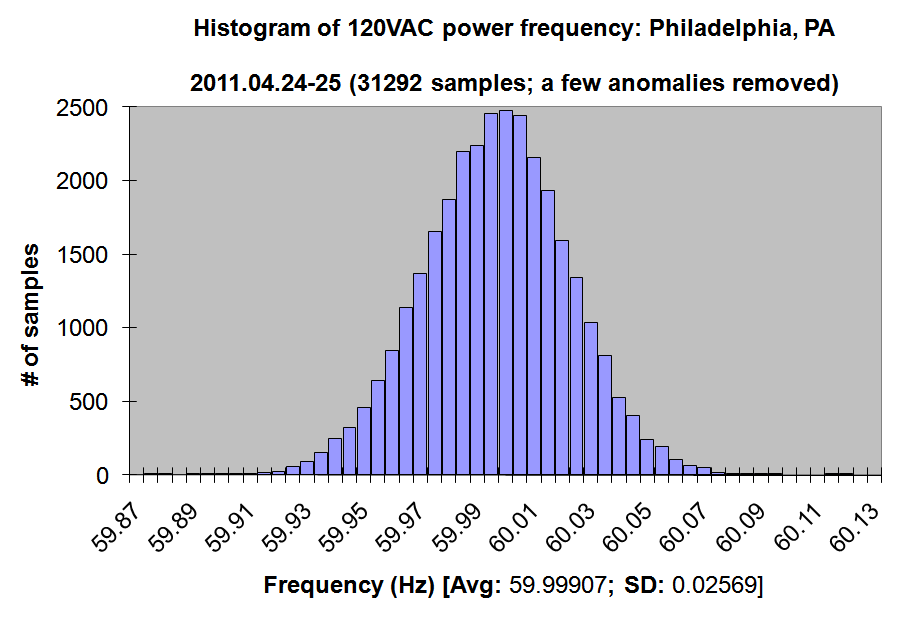
Frequency histogram (anomalies removed.) Click for larger.
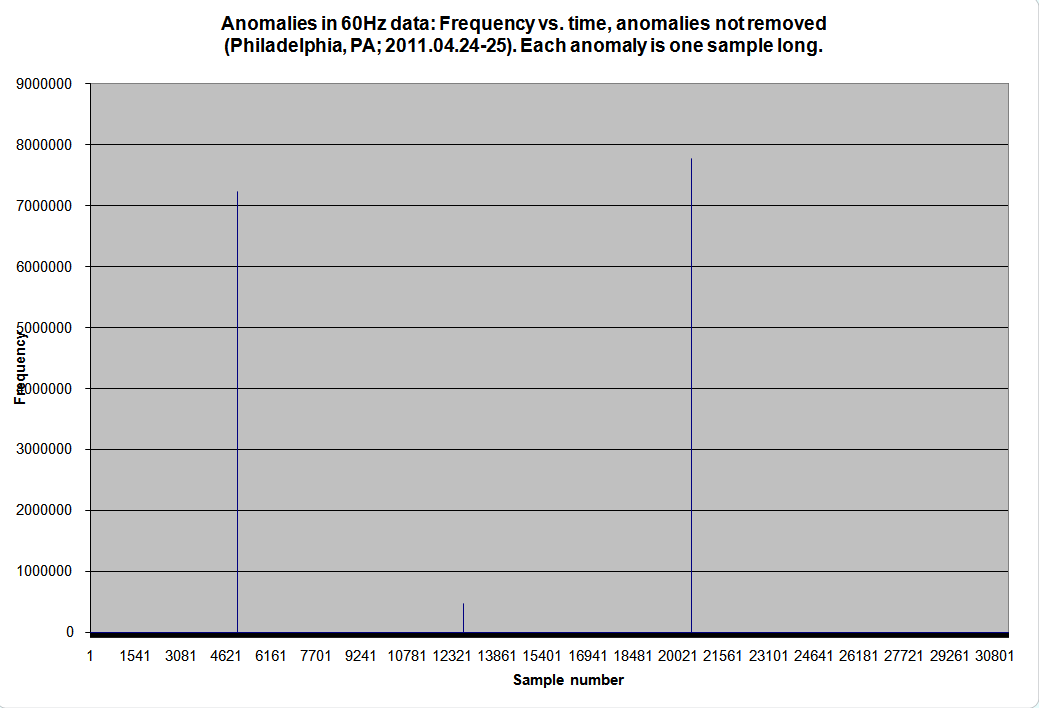
Frequency anomalies. Each was far outside the 60Hz spec, and lasted for a single sample. Click for larger.
So in conclusion, the frequency appears to be extremely stable — the average (excluding the three anomalies) was 59.99907Hz, with a standard deviation of 0.02569Hz. On average, the frequency was about 15.56ppm off. Two standard deviations corresponds to roughly an 0.0856% error, or 856 parts per million.
If you were to set a clock by the 60Hz timebase (and some mechanical clocks, at least, do use this method), it would probably gain or lose one second every 17 or 18 hours, if it were to have a low-pass filter to ignore the anomalies (and mechanical clocks would inherently be unaffected by these.)
The frequency ratio between two musical notes (in the chromatic scale common in Western music) is 2^(1/12). If 60Hz were the desired frequency of a musical note to be played, the next half-step up would be at ~63.567786Hz. This is about 138 standard deviations. (Assuming a Gaussian distribution, as suggested by the histogram above, this essentially means such a value would never happen in the expected lifetime of the Universe, and then some.) This also approximately corresponds to the “just-noticeable difference” between two pitches — meaning that the difference in frequency would have to be at least this much to be perceived by most people as different from 60Hz. In other words, the 60Hz of the AC power network is, musically, quite pure indeed.
The anomalies call for more investigation. About every eight thousand samples, a single sample appears with a count far outside the Gaussian distribution otherwise seen. To call these anomalies “outliers” would be a huge understatement; the smallest of these is hundreds of millions of standard deviations away from the mean. Clearly, another phenomenon is at work here. Could PECO be encoding periodic data in the power? If so, what are they saying??


